If you’ve participated in an auction league, you already know that the actual bids don’t align well to the values spit out by traditional auction calculators, such as the one over at FanGraphs. The top players sell for much more money than they “should” and there are plenty of bargains near the end of an auction, where players valued at $10 could sell for a single dollar. A lot of the discrepancy stems from how we view replacement players. If you don’t play in auction leagues, stick around until the end, because this is useful for snake drafts as well.
Whatever method is used to create values – SGP/z-scores/PVM – those values need to be converted from an absolute scale to a relative scale, by establishing a baseline. For example, the SGP of a replacement player can be subtracted from each hitter since those replacement hitters can be acquired for free. The problem is how to define the replacement player. In a 15-team league with 14 hitters per team, the 211th hitter’s stats can be used as the replacement hitter. Or a different replacement player can be established for each position. Or more simply, hitters can be classified hitters into two groups; catchers and non-catchers. Larry Schechter details a unique method in Winning Fantasy Baseball of creating dollar values for hitters with SGP, and using the “211th hitter” method for both AL-Only and NL-Only leagues. He then converts those Mono-league values to Mixed-league values by reducing them as they drop toward replacement (ie: for $21-25 mono-league values subtract $12 to get mixed league value, for $17-20 mono-league value subtract $15, and so on). This is a disjointed approach, and it kind of works. It’s certainly better than just winging it, and mentally adjusting players on the fly. But I wanted to find a better way. The major issue is that the “211th hitter” method over-values mediocre players. Here’s a table showing hitter values from the FanGraphs Auction Calculator for a 15-team league vs aggregate auction prices from 6 actual NFBC 15-team auctions in 2021.
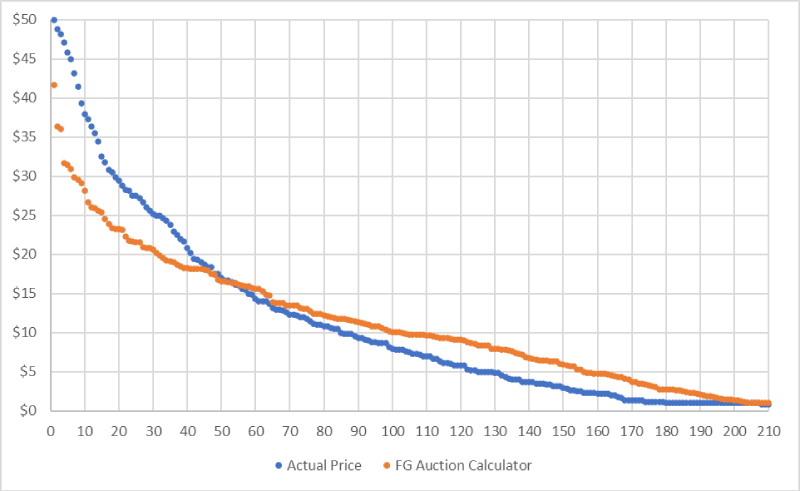
At the ~169th-best hitter, actual auction data shows this is the point where hitters begin to sell for $1, but the FanGraphs Auction Calculator still suggests a value of $4. The total dollars here are identical; $2400 or $160 per team. The difference is only in the distribution. This isn’t a difference of projections; it is purely due to how the same stats are converted to dollars. One likely reason for this discrepancy is that there are so many good players available on waivers/FAAB in a mixed league that it makes little sense to invest much money in mediocre players. All that money that isn’t spent on those mediocre players (below the orange curve and above the blue curve) needs to be shunted to the top. Rather than the crude approach mentioned above, I prefer being more methodical. The Auction Calculator can be told to create values for a 12-team league (168 players) rather than 15-team (210 players). This will set the replacement player as the 169th player. A value of $1 is assigned to the next best 42 players and the remaining dollars distributed as usual to the top 168 players based on their SGP, ensuring the total dollars matches what is available to be spent. This chart shows the result.
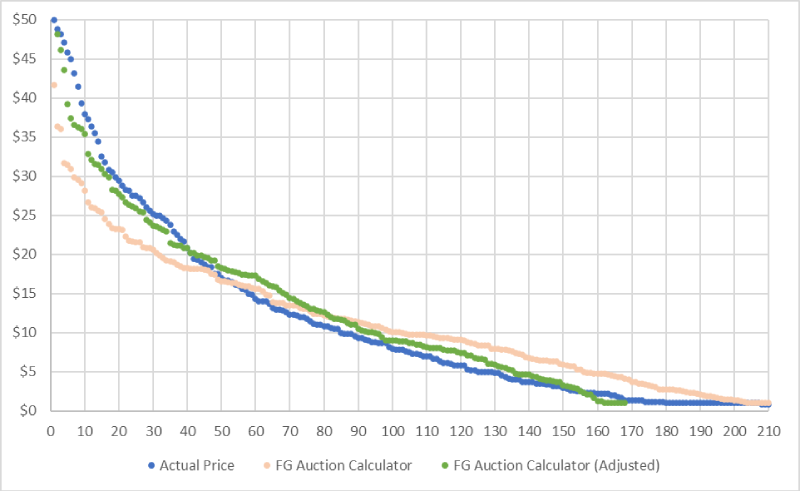
Much better. The space between the curves has been greatly reduced, and with further tweaks the gap can be closed even more. The beauty of this method is the simplicity. It can all be done with the FanGraphs Auction Calculator with a few simple tweaks. All that needs to be done is to reduce the teams from 15 to 12, increase dollars per team from 260 to 326, and assign $1 to all players between 169-210. I would also recommend that the positions be input simply as 2 Catchers and 12 UT rather than by the actual position requirements, because the FanGraphs Auction Calculator does a poor job of assigning positional value. This process can also be done manually in Excel, which allows the replacement value to be set more precisely (rather than in intervals of 14 hitters or 9 pitchers), and to make custom adjustments for catchers and multi-position eligible players. Similar adjustments can be made for pitcher values, although I prefer to use an entirely different approach.
Having these adjusted values is useful for non-auction leagues, too. Consider a trade where one team offers two $15 players for a $30 player. Using default Auction Calculator values, this is fair. But it doesn’t feel right. Looking at the adjusted values you can see that a fair trade would actually be two $15 players for a single $23 player. The adjusted values are also useful when planning a draft draft. There’s much talk about hitter/pitcher split in auctions (ie: 64/36) which is mostly ignored in non-auction leagues. Assigning slot values to each draft pick helps track team balance.